| Table 1. Disorder prediction results – AUC scores for different methods are compared. |
| The predictions from the DISOclust server are compared with those obtained from an in-house version of DISOPRED. |
| The DISOclust_server is a fully automated method that compares models obtained from the nFOLD3 server. |
| The DISOclust_manual method uses models obtained from all of the CASP8 servers. |
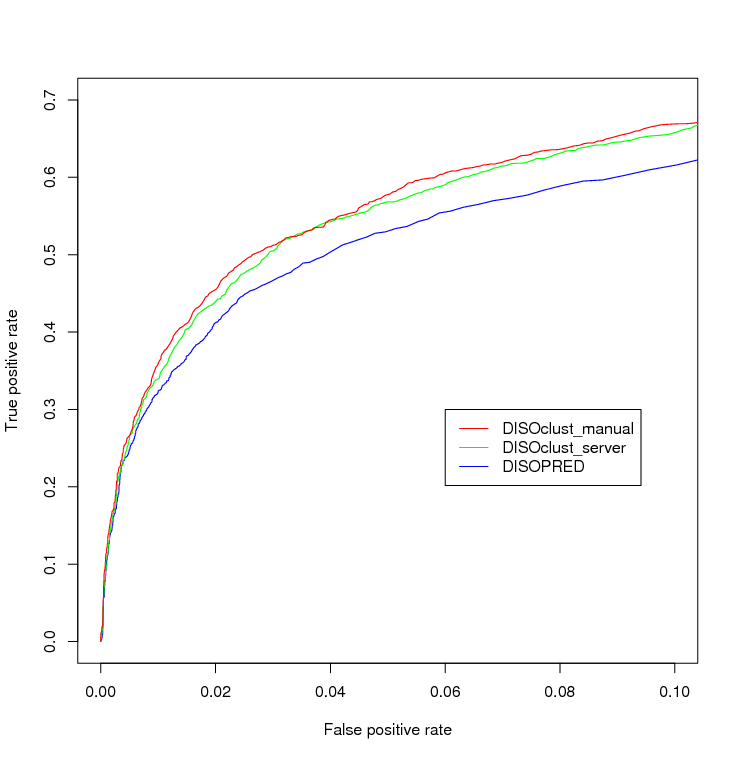
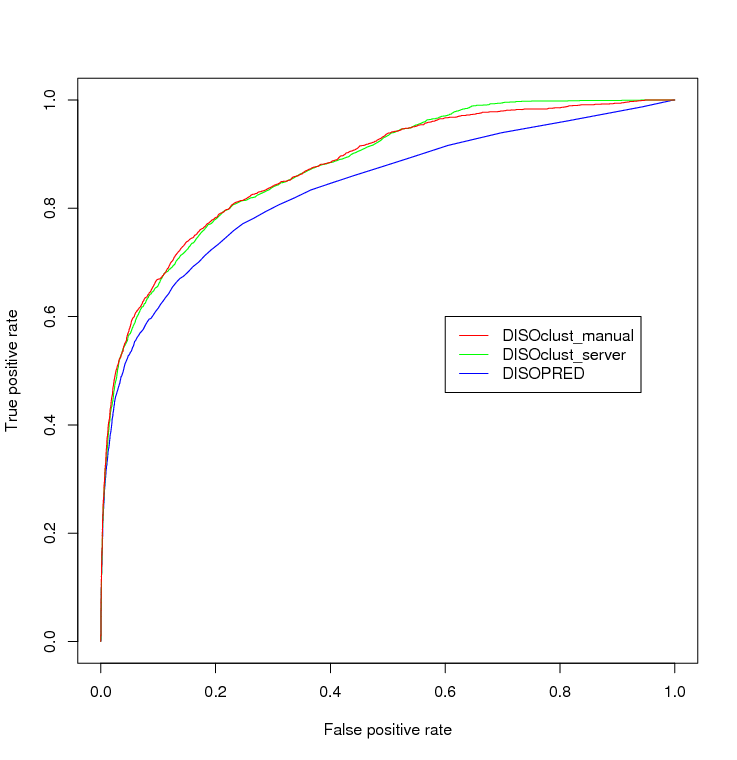
| AUC, Area Under Curve (see ROC plots below); SE, Standard Error in AUC score; |
| AUC(0-0.1), partial area under curve between 0-0.1 false positives; %Improvement, AUC improvement over DISOPRED alone |
| Disordered residues are defined as those with missing coordinates in the PDB file. |
|
|
|
|
|
|
|
|
|
| Method |
AUC |
SE |
AUC (0-0.1) |
AUC-SE |
AUC+SE |
% Improvement |
|
|
| DISOclust_server |
0.8771 |
0.0051 |
0.0529 |
0.8720 |
0.8823 |
4.1 |
|
|
| DISOclust_manual |
0.8759 |
0.0052 |
0.0538 |
0.8708 |
0.8811 |
3.98 |
|
|
| DISOPRED |
0.8361 |
0.0055 |
0.0493 |
0.8306 |
0.8416 |
- |
|
|
|
|
|
|
|
|
|
|
|
| Figure 1. ROC plot – partial plot, low false positive rate |
|
| Figure 2. ROC plot – full plot |
|